- Data from multiple years helps any farmer make informed decisions
- Important factors to consider are the relative yield potential of current crop stand versus replanting, as well as the costs associated with replanting
- Try to leave emotions out of the debate and determine the rand value gain or loss in your decision making
This article is a summary of the past two seasons of trial data on the same stands, sites, cultivars and practices in an effort to better understand the response of replanting maize and enabling farmers to make informed decisions. Replanting is something that no farmer ever wants to do, but sometimes unforeseen events necessitate it.
Questions asked annually:
“I planted 50 000 p/ha, but now there is only 40 000 or 35 000 p/ha. Should I replant or not? What is going to be my possible loss if I don’t replant?”
Or
“I planted 50 000 p/ha, but now there is only 40 000 or 35 000 p/ha. It is already December 1st. Should I replant or not? What is going to be my possible loss if I don’t replant?”
Method:
- Two maize cultivars, one single-headed (P1513) and one multi-headed, (P1975) were planted two weeks apart over four planting dates from early October.
- At each planting date, a stand of 55 000 p/ha was planted and later thinned out to the specified stand for that relevant planting date.
- The main stands that were important for measurements were: 55 000, 45 000, 40 000 and 35 000 p/ha.
- From each main stand, it was then thinned out at each planting date to 80%, 70% and 60% of that relevant stand and planting date.
- The yield was then determined at each treatment for each stand.
- This trial was duplicated and repeated in year 2.
Purpose of the trial:
Apart from the fact that the data should be helpful to a farmer to determine whether the juice is worth the squeeze, we can also make the following measurements from the data:
- Planting date effect on yield (multi-year trial)
- Stand effect on yield in single-headed and multi-headed cultivars
- Stand and planting date effect on yield in single and multi-headed cultivars
- Loss of yield due to stand loss
Results (average of the last 2 seasons):
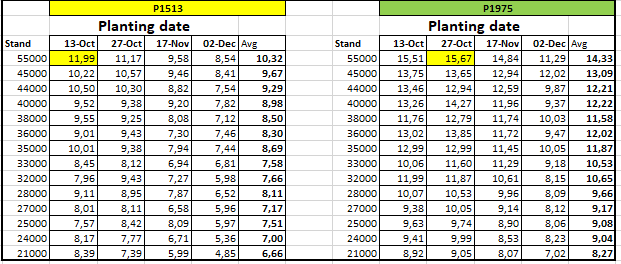
Table 1: Yield of both cultivars at each planting date and all stands measured. In Table 1, all the yields of each cultivar at each planting date and stand over the past 2 seasons can be seen.
P1513’s best yield was at 55 000 plants/hectare on the 13 October planting date (11.99 t/ha). P1975’s best yield was on the 27th of October at 55 000 plants/hectare (15.67 t/ha). P1975 consistently outperformed on all stands and planting dates, mainly because P1513 received much more northern leaf blight over the past two seasons.
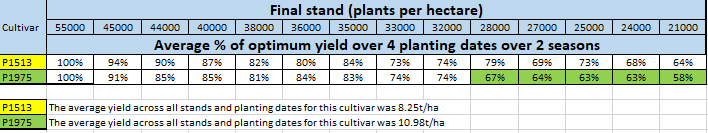
Table 2: The average of the optimal yield over 4 planting dates for both cultivars in the trial over the last 2 seasons. Table 2 gives you a glimpse of how the two cultivars performed over the different planting dates and stands. Both cultivars produced the best results at 55 000 plants/ha and thereafter the yields systematically levelled off to the lowest level of 21 000 plants/ha. After the first season, it was interesting to see that the single-headed cultivar (P1513) deviated less from the maximum yield at 55 000 p/ha at lower stands.
The logical expectation would actually have been that the multi-headed cultivar (P1975) would compensate more at lower stands and therefore the deviation at lower stands would not be so different from the maximum at 55 000 p/ha. It was exactly the same in year two of the trial and in Table 2, which shows the average figures for both years. It can be seen that from 28 000 (28k) to 21,000 (21k), the multi-headed hybrid fares worse than if there is a stand loss up to that level. Although P1975 still yields more t/ha at stands between 28k to 21k, the percentage difference from the maximum yield is more on P1975 than P1513.
To make the data obtained from the trial more practical, it will be further explained in Table 3.
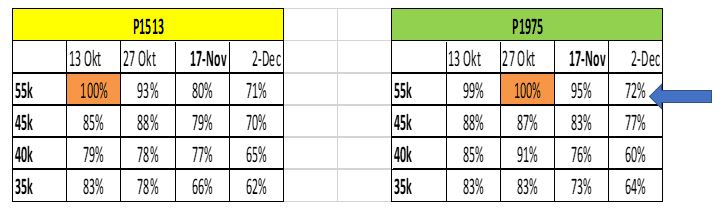
Table 3. Percentage deviation from the maximum (100%) at different stands and planting dates over two seasons.
Table 3 explains the outcome of the trial very simply. As an example, look at Table 3 at the value at the blue arrow. On 2 December, 72% of the yield was harvested at 55 000p/ha. Compare this with the 100% you would have harvested on the 27th of October with this cultivar on the same stand.
Table 4 puts more meat on the bone and looks at all stands we have measured over the past 2 seasons in the trial. Both cultivars’ data are combined here in one table.
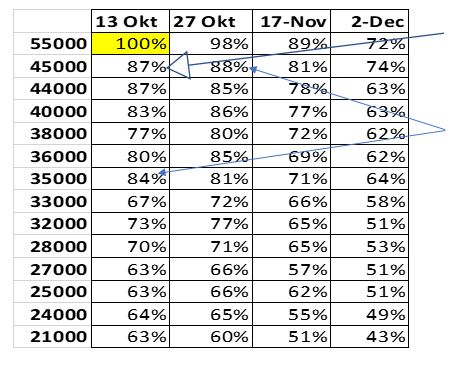
Table 4: Percentage deviation from the maximum (100%) at all stands and planting dates over the last 2 seasons.
Example: Farmer plants on the 13th of October @ 45 000 p/ha. He had only 35 000 p/ha success and decides to replant on 27th October @ 45 000p/ha. (Follow the blue arrows in the representation).
- A farmer would potentially have stripped 87% of a full crop with 45 000p/ha.
- At 35 000 p/ha on the same planting date, he has 84% of maximum potential left.
- With the transplant on 27th Oct, again @ 45 000 p/ha, he has 88% of maximum potential.
- 84% of maximum potential with 35 000 p/ha versus 88% of maximum potential with 45 000 p/ha.
- He, therefore, lost money in the first place by not producing a full stand.
- He would also only enjoy a 4% advantage to transplant again 2 weeks later (is it worth it?).
A deeper look at the data
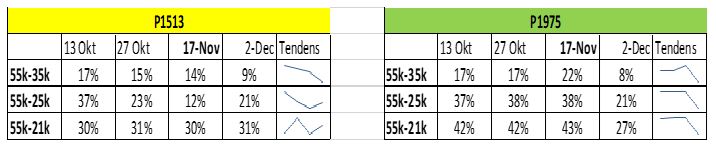
Table 5: % Difference in yield between specific stands over 2 seasons.
In Table 5, we looked more specifically at stands that make it almost obvious to consider a replant. The difference in return is expressed here as a percentage and 55k are compared with 35k, 25k and 21k. The difference between the stand with the best yield (55k) and a stand where you are going to seriously consider replanting becomes smaller as it gets later in the season.
From the table above, you can see four out of six times that the trend over time tends towards a smaller difference in return if your position was not sufficient. What this means is that you have less reason to consider replanting, especially if the season has already moved into December. For example, look at the two-year data of P1975: Early in the season the difference between 55k and 35k is around 17%, but if you go to a December planting date, the difference is only 8%. The same trend is visible at the difference between 55k and 25k. Early on, the difference is around 38%, but in December it drops to 21%.
Summary
Whether to replant or not to replant is always going to be an appropriate question in any season. There are seasons where it comes more to the fore, but with this research in South Africa, we are trying to pave the way for our customers to make more informed decisions on our cultivar package.
This test will be repeated for several years to get a good average answer. After year one, the feeling was that you shouldn’t replant most of the time. In the cases where the data did show that a yield increase was possible with a replant, the cost implication would in many cases have drawn the scale back into balance. After two seasons, the data continues to show us that a replant does have a place in certain cases, but that in most cases it is still not worth the effort and cost to replace what has already germinated and grown.
Attempts to replant where the stand is not adequate also usually lead to additional problems. Larger plants compete more strongly for nutrients, water and sunlight, and in many cases perform the same role as weeds compared to the smaller plants in the headland. It is therefore advised that, if a replant is warranted, the remaining plants must be worked out and started from scratch. If the remaining position is acceptable, leave it at that and accept the position as it is.
For more information, go to www.pioneer.com/za or send an email to info.rsa@pioneer.com